
Market Commentary: The Money Illusion and Oil Prices
- Yves Siegel
- Apr 27
- 8 min read
Stocks soared and oil prices plunged on the heels of Iran claiming that the Strait of Hormuz is “completely open” on April 17th. However, the situation remains fluid and could reverse quickly. Iran’s declaration is linked to the continuation of the Israel-Lebanon ceasefire and contingent on removal of the U.S. naval blockade, which President Trump has said will remain “in full force” until a formal peace agreement is reached.
THE MONEY ILLUSION AND OIL PRICES
In this commentary, we highlight the money illusion (tendency to think in nominal rather than real, inflation-adjusted terms) and provide context in which to view the potential impact on the energy sector from what the International Energy Agency (IEA) describes as the largest oil supply disruption in history. History suggests that the energy sector will be a net beneficiary if the supply disruption does not trigger demand destruction. Currently, meaningful demand destruction in the U.S. does not appear to be the base case.
The International Monetary Fund in its April 2026 Article IV Consultation projects 2026 U.S. GDP growth at 2.4% on a Q4/Q4 basis, consistent with 2024’s pace and ahead of 2025’s 2.0% — significant, but not recessionary, and consistent with the money illusion thesis that the real economic burden is more manageable than the nominal headlines suggest. At SAM Partners, we remain constructive on the midstream sector that is relatively insulated from commodity prices. The sector’s earnings are closely tied to volume and consumption growth -the secular trends which remain positive.
WHAT THIS MEANS FOR OUR PORTFOLIOS
Our midstream companies earn fee-based revenues tied to volumes, not commodity prices. They are largely indifferent to whether WTI is $70 or $100. We recognize that a near 50% jump in gasoline prices is painful for consumers, especially lower income families. However, in real dollars and as a percentage of disposable income, energy is more affordable today than in years past. That’s the point. The illusion of money can distort perception from reality and may lead to poor economic decisions.
KEY TAKEAWAYS:
THE U.S. IS RELATIVELY INSULATED FROM THE GLOBAL PRICE SHOCK. The income-share and energy intensity data indicate that today’s price environment in the U.S., while elevated, does not carry the economic weight of the 1970s and 1980s crises. The demand destruction is concentrated outside the U.S. Specifically, the IEA’s April 14th Oil Market Report projects global demand dropped 2.3 mbbl/d in April, the steepest monthly drop since COVID, and projects a full-year 2026 net decline of 80 kbbl/d, a swing of nearly 930 kbbl/d from its pre-war forecast of growth.
As the following table shows, Asian physical crude prices surged to $150–158/bbl at the peak (more than $60/bbl above WTI) reflecting acute Gulf supply shortages that the global futures benchmarks do not fully capture. That disconnect is money illusion in reverse: the price of WTI understates the severity of the shock being absorbed by the rest of the world. As a net energy exporter, the U.S. is meaningfully better positioned than countries that are net energy importers. Hardest hit are the nations of Africa, which can least afford the spike in energy prices.
Crude Oil Price Divergence: Global Benchmarks During The 2026 Iran War

Sources: S&P Global Platts; CNBC; Trading Economics; IEA Oil Market Report (April 14, 2026). Peak crisis prices reflect mid-to-late March 2026. Post-Hormuz prices as of April 17, 2026 close. Dubai and Oman are physical spot benchmarks for Gulf crude delivered to Asian buyers; WTI and Brent are futures benchmarks reflecting Atlantic Basin supply.
THE CURRENT CRISIS IS SUPPLY-DRIVEN.
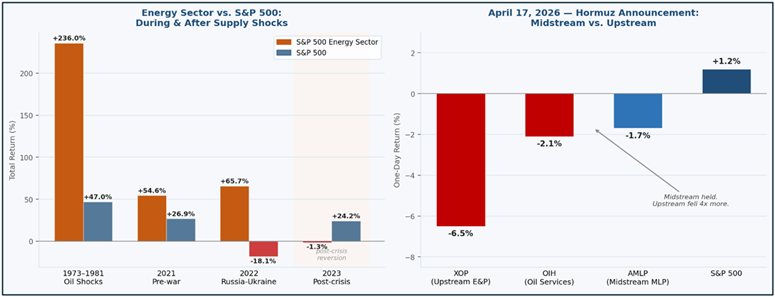
Energy equities have outperformed during every prior supply shock — most recently in 2022, when the energy sector returned +65.7% against a broad market decline, the widest gap ever recorded. The 1970s told the same story over a decade. The post-crisis picture is more nuanced: when prices normalize, upstream equities tend to give back gains, as they did in 2023. Midstream is not immune to that dynamic, but it is far better insulated, as demonstrated on April 17th when upstream E&P names fell -6.5% the AMNA, the Alerian Midstream Energy Index encompassing both C-corps and MLPs, fell just -0.83%.
Sources: S&P Dow Jones Indices; Bloomberg; Hamilton (2011); Benzinga; Yahoo Finance; Alerian.
THE STRUCTURAL DEMAND STORY HAS NOT CHANGED.
U.S. natural gas demand is projected to grow by 20–28 Bcf/d by 2030 (Wood Mackenzie and ICF, respectively), driven by LNG exports, AI-related power demand, and industrial onshoring. The electricity story is also compelling: after 15 years of flat demand, U.S. electricity consumption has accelerated at 2.1% per year, driven by AI data centers, EV adoption, and industrial electrification—all occurring simultaneously with coal plant retirements. The midstream energy sector is poised to benefit from the infrastructure required to meet growing demand, i.e., pipelines, processing, storage, and power.
OUR STANCE:
The nominal headlines may suggest crisis. The real data, at least for the U.S., tell a more compelling story. We invest in the infrastructure of the energy system—not the price of the commodity. More infrastructure is required to meet growing demand, both for our domestic consumption as well as exports. The economic burden of energy is more manageable than perceived. And the infrastructure serving that demand is supported by durable, inflation-resistant fundamentals that the money illusion should not obscure.
MONEY ILLUSION: SEPARATING THE SIGNAL FROM THE NOISE
Money illusion was first described by economist Irving Fisher in 1928. It is the tendency to think in nominal rather than real, inflation-adjusted terms. When gasoline jumps from $2.81/gallon in January to $4.11 in mid-April—a rise of $1.30, or about 46%, since the start of the war—the reaction is visceral and understandable. But when adjusted for inflation, measured against rising incomes, and evaluated against an economy that now generates nearly three times more output per BTU than it did in 1970, the real burden is considerably less severe than it appears. Three data points make the case:
1. Oil and gasoline: the nominal vs. real story
When you adjust for inflation, the current oil price spike, while real, looks considerably less alarming than the nominal numbers suggest.
The 1980 nominal peak of $36/bbl translates to roughly $275 in today's dollars. WTI at ~$85/bbl today, after the post-Hormuz selloff, is less than half that level in real terms. At the pump, the 1981 real high of $4.85 per gallon has not been exceeded. The national average reached ~$4.11/gallon in mid-April 2026—elevated, but still well short of the 1981 real peak in purchasing-power terms.
The 2022 spike from Russia’s invasion of Ukraine—the most politically disruptive energy event in a generation—was, in real terms, comparable to the mid-range of the 2011–2014 price environment. Today's environment, despite the dramatic headlines, falls into the same category.
Crude Oil and Gasoline: Nominal vs. Real Prices (2025 USD)

Crude oil ($/bbl) and gasoline ($/gallon), nominal vs. real (2025 USD). Sources: EIA; BLS; Hamilton (2011); BP Statistical Review.
2. The most important metric: energy as a share of income
Nominal prices may get all the attention, but the measure that actually captures household pain is energy expenditure as a percentage of disposable personal income.
At the height of the 1970s–1980s crises, households devoted 8–9% of disposable income to energy—a genuine economic emergency. Today, that figure sits near 5–6%, in line with the long-run post-1990 average. Even with Q1 2026's price surge, the income-share figure will tick only modestly higher because real incomes are substantially larger than they were fifty years ago.
U.S. Consumer Energy Expenditure as % of Disposable Personal Income

Sources: BEA Personal Income & Outlays; EIA Consumer Expenditures; University of Michigan Energy Factsheet.
3. The resilience story: 69% less energy per dollar of GDP
The U.S. economy has become dramatically more efficient at converting energy into output. In 2023, the U.S. economy consumed 69% less energy per dollar of real output than it did in 1970. An economy that once required 18 BTUs to generate a dollar of GDP now requires fewer than 6. As such, an $85 oil price today simply does not impose the same economic drag it would have imposed forty years ago.
The decoupling of consumption from price is equally striking. U.S. petroleum consumption peaked at 20.8 million barrels per day in 2005 and has remained essentially flat for nearly two decades, even as WTI prices swung from $43 to ~$100 and back. Today’s Iran war price spike is occurring against a backdrop of structurally anchored demand, not the rapidly growing consumption that made the 1970s crises so damaging.
U.S. Petroleum Consumption vs. WTI Price (2000–2026)
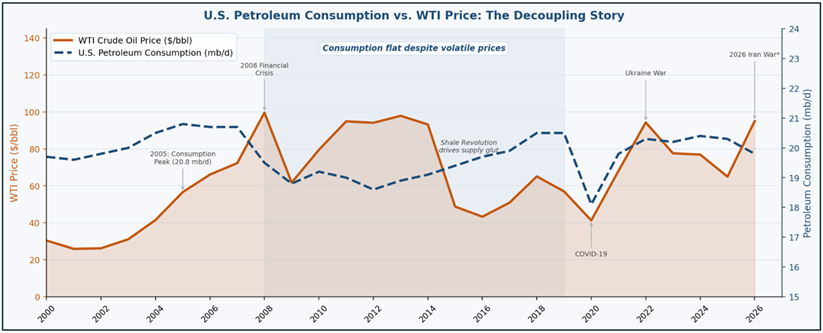
Sources: EIA Annual Energy Review; EIA Short-Term Energy Outlook, April 2026; BP Statistical Review of World Energy 2025. *2026 figures estimated/preliminary.
APRIL: ENERGY CONTINUES TO LEAD
The rundown:
In March, SAM’s Infrastructure Income Portfolio produced a return (net of fees) of 3.3% compared to -5.0% for the S&P 500 and 1.6% for its customized benchmark. The performance relative to benchmark reflect our overweight in midstream and lower weights in the utilities and clean energy sectors.
In March, SAM’s Energy Transition Portfolio generated a return (net of fees) of 1.2% vs 0.4% for its customized benchmark.
SAM’s portfolios are more heavily weighted in Midstream, which outperformed relative to the clean energy sector and utilities in March.
Midstream outperformed the overall market and was up in March with a total return of 3.9% as measured by the AMNAX.
In March, the clean energy sector outperformed the overall market, generating a total return of -1.1% as measured by the S&P Global Clean Energy Index (SPGTCLTR). For the month, utilities outperformed the market with a total return of -2.8% as measured by the Philadelphia Stock Exchange Utility Index (XUTY).
Except for Energy, all sectors’ performance in the S&P 500 was negative. Energy was the best performer and Industrials was the worst. Energy delivered a 10.4% monthly total return. March month-end WTI crude oil and Henry Hub natural gas prices were $102.86 per Bbl and 2.88 per MMBtu, up ~54% and down ~4%, respectively from last month.
RESULTS: SINCE INCEPTION & ONE YEAR
SAM’s Infrastructure Income Portfolio produced a return (net of fees) of 194.0% and 20.0% for the periods since 11/10/20 inception and 1-year, respectively. This compares to a total return of 183.6% and 29.0%, respectively, for its customized benchmark and 99.3% and 17.8%, respectively, for the S&P 500 as of 3/31/26.
SAM’s Energy Transition Portfolio generated a return (net of fees) of 53.7% and 30.9% for the periods since 4/29/21 inception and 1-year, respectively. This compares to a total return of 62.0% and 41.4%, respectively, for its customized benchmark and 66.6% and 17.8%, respectively, for the S&P 500 as of 3/31/26.
YTD 2026 Total Return

Source: Bloomberg, NASDAQ and S&P Global

Sam Partners’ Infrastructure Income and Energy Transition Strategies seek to provide sustainable income and growth with capital preservation. This is accomplished by investing in a concentrated portfolio of high-quality midstream energy companies, utilities and clean energy companies that are well positioned to participate in the energy transition to a net zero carbon future. A diversified approach to investments across these sectors should optimize risk-adjusted returns, in our view. Our Infrastructure Income Strategy offers investors a current yield of ~4% and growth potential of ~5-7%; while the Energy Transition Strategy that is more heavily weighted with clean energy stocks and aligns with favorable ESG ratings, offers investors a current yield of ~3.0%. In a world searching for yield, we believe these Strategies offer a compelling value proposition.
IMPORTANT DISCLOSURES
Siegel Asset Management Partners is a registered investment advisor located in Plainview, New York. The views expressed are those of Siegel Asset Management Partners and are not intended as investment advice or recommendation. This material is presented solely for informational purposes, and nothing herein constitutes investment, legal, accounting or tax advice, or a recommendation to buy, sell or hold a security. No recommendation or advice is being given as to whether any investment or strategy is suitable for a particular investor. Information is obtained from sources deemed reliable, but there is no representation or warranty as to its accuracy, completeness, or reliability. All information is current as of the date of this material and is subject to change without notice. Third-party economic, market or security estimates or forecasts discussed herein may or may not be realized and no opinion or representation is being given regarding such estimates or forecasts. Certain products and services may not be available in all jurisdictions or to all client types. Unless otherwise indicated, Siegel Asset Management Partners' returns reflect reinvestment of dividends and distributions. Indexes are unmanaged and are not available for direct investment. Investing entails risks, including possible loss of principal. Past performance is no guarantee of future results.


Comments