
Market Commentary: Energy Makes a Comeback
- Yves Siegel
- Mar 1
- 9 min read
ENERGY STOCKS DOMINATING IN 2026
Energy is the top performing sector year-to-date with a price return of 22.0% vs. 0.9% for the overall market as of 2/20/26. So, what is driving the outperformance? Let’s distinguish the signal from the noise:
REVERSION TO THE MEAN. After several years of underperformance, energy is the top performing S&P 500 sector by a wide margin after being near the bottom last year—

Source: Bloomberg. Performance figures as of 2/20/26
—and yet the energy sector as a percentage of the S&P 500 market capitalization remains well below historical peaks.
Energy Sector Weighting in the S&P 500

Source: Wells Fargo Securities, LLC Midstream Monthly Outlook: February 2026 published on 2/3/26
Note: "High", "Average", "Median" and "Low" metrics in the grey box are based on data for the entire period (1989-present).
MARKET ROTATION. After three years of outsized performance, investors are rotating out of growth stocks and into perceived value and cyclical stocks, as epitomized by the Magnificent Seven. Some attribute this shift to “tech fatigue” or concerns about a potential artificial intelligence (AI) bubble, reminiscent of the late-1990s tech/dot-com cycle. While AI may disadvantage certain sectors, such as parts of software, energy companies are more likely to benefit as adopters of AI.
GEOPOLITICAL RISKS HAVE TRUMPED AN AMPLY SUPPLIED OIL MARKET. Oil prices—as measured by West Texas Intermediate (WTI)—bottomed at $55 per barrel in December and have steadily climbed higher due to heightened potential of U.S. military action against Iran. The main area of concern is Iranian threats of closing or disrupting traffic through the Strait of Hormuz where about twenty million barrels per day of oil and petroleum liquids transit. Additionally, closure would impact liquefied natural gas (LNG) exports, mainly from Qatar.
CHANGING NARRATIVE IN SUPPORT OF FOSSIL FUELS. The sentiment toward fossil fuels has clearly improved with the emergence of a more pragmatic approach to energy. However, advocacy for renewables remains strong. In our view, affordability, availability, and relative abundance currently favor fossil fuels over renewables. (See Secretary Burgum comments on page 3).
SECULAR GROWTH IN NATURAL GAS DEMAND. U.S. LNG exports are expected to nearly double by 2030, and natural gas is likely to be the primary fuel powering data centers. Combined, natural gas consumption is poised to grow by ~22 Bcf/d by 2030, up significantly from ~110 Bcf/d in 2024, according to Wood Mackenzie.
HIGHER OIL AND NATURAL PRICES. WTI prompt crude oil futures have rebounded ~20% from its 52-week low of $55 per barrel reached in December of last year. The prior decline was largely due to supply growth outpacing demand growth. Even after the rebound, oil prices remain below last year’s price of ~$72.50. However, a major oil supply disruption could send prices above $100 per barrel.
Natural gas futures peaked above $7.00/MMBtu at the end of January due to Winter Storm Fern but have since settled back down to $3.05/MMBtu as of this writing. Some E&P companies, notably EQT Corp. (NYSE:EQT), took advantage of the spike in futures and hedged production.
Crude Oil and Natural Gas Prices 2025 to YTD 2026
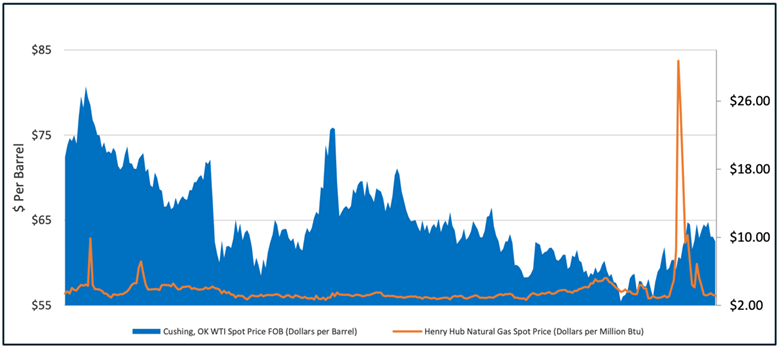
Source: Energy Information Administration (EAI)
ATTRACTIVE RELATIVE VALUATION. The market has shifted from growth toward value investing, as illustrated by the year-to-date outperformance of the Russell 1000 Value Index relative to the Russell 1000 Growth Index.
Russel 1000 Value vs. Growth (2021 to YTD) Performance
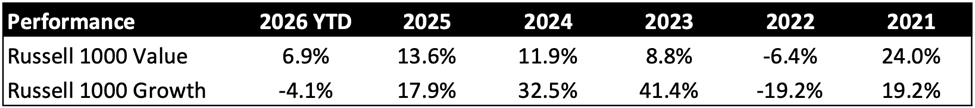
Source: Bloomberg. Performance is as of 2/20/26.
OUR TAKE: While The energy sector is no longer “cheap” based on historical absolute multiples of price-to-earnings and cash flow, it still provides an attractive value proposition based on free cash flow and returning cash to shareholders via growing dividends and stock buybacks.
As we often note, the energy sector over the past several years has demonstrated financial discipline, resulting in strong balance sheets and higher returns on capital. In the midstream subsector specifically, average dividend yields of ~5% plus an average dividend growth rate of ~5% should provide income-oriented investors with potentially attractive total returns.
At SAM Partners, we continue to favor midstream companies positioned to benefit from the secular step-up in natural gas demand. Three of our top five largest holdings in SAM’s Infrastructure Income portfolio are natural gas-focused companies including ETP, LNG and WMB.
TAKEAWAYS FROM WILLIAMS ANALYST DAY
We attended Williams 2026 Clean Energy & Technology Expo and Analyst Day events held February 9th and 10th in Washington DC. Here’s an overview:
Williams’ Growth Leveraged to Increasing Gas and Power Demand
Unsurprisingly, the central theme was the soaring demand for natural gas and power, and how well positioned Williams is to benefit from these secular tailwinds. Indeed, the company raised its targeted EBITDA (read cash flow proxy) compound annual growth to 10%+ through at least the end of the decade, up from its previous target of 5–7%. They significantly exceeded the latter target as the company grew at a 9% CAGR from 2020 to 2025. Helping to propel the accelerated growth is Williams’ plan to invest $7 billion in high return power innovation projects for hyperscalers over the next couple of years.
Growing Need for Reliable Natural Gas Infrastructure
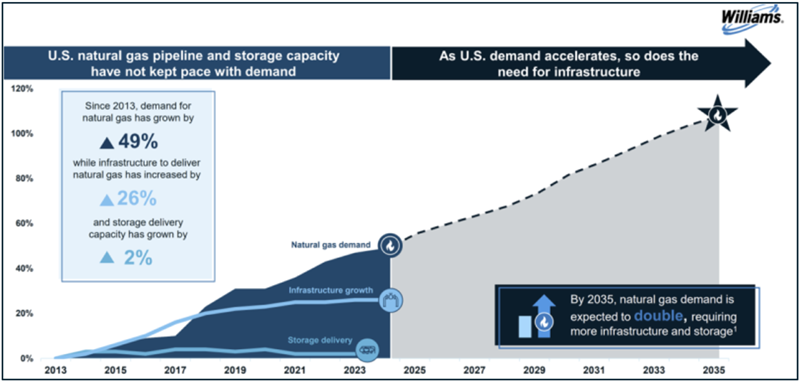
Source: 2026 Williams Analyst Day Presentation Source (left): U.S. Energy Information Administration (EIA).
Note: 2023 is most current storage delivery data. Source (right): Wood Mackenzie North America Gas, Investment Horizons Outlook 2025.
1 Natural gas demand 2013 vs. 2035
Current Administration Strongly Supportive of Fossil Fuels
The keynote dinner speaker was the very impressive and articulate Secretary of the Interior Doug Burgum. He is also the chair of the Trump administration’s National Energy Dominance Council. Clearly, the administration seeks to grow U.S. energy production that is essential to win the AI race, but this will consume vast amounts of power. Low-cost energy is a U.S. strength that should be exploited, not wasted. Hence, the administration’s promulgation of policies that promote the production and consumption of fossil fuels; namely, natural gas, crude oil, and coal. The administration is also very supportive of nuclear.
Current Administration Less Supportive of Clean Energy
Secretary Burgum downplayed renewables and subsidies promoting their development primarily because of their intermittency and unreliability. Interestingly, he emphasized the need for reliable, abundant, and affordable energy while leaving out the need for “clean” energy. Secretary Burgum suggested that the hysteria (our word) over climate change is overdone and that the science of climate change has yet to be settled.
His comments around clean energy were somewhat incongruent with the expo’s theme of clean energy and technology, particularly Williams’ tag line, “We Make Clean Energy Happen.” We would not be so dismissive of renewables as they will continue to contribute to the energy mix and still are the fastest growing power source. In its February Short-Term Energy Outlook, the EIA projects a 17% increase in solar generation in 2026 and an additional 23% increase in 2027, and wind generation increases by 6% and 7%, respectively, over those years.
U.S. Annual Electric Power Sector Generation by Source

Source: U.S. Energy Information Administration, Short-Term Energy Outlook, January 2026
Additionally, we strongly suspect that companies will not abandon their decarbonization targets, will invest in projects that generate attractive returns such as carbon capture and sequestration, and find ways to produce energy more cleanly and cost effectively. Just as the Trump administration has reversed many decarbonization initiatives of the prior administrations, the next administration may reverse policies again with new clean energy mandates.
A Pragmatic Regulatory Approach
We think it would be a mistake to conclude that, based on their remarks, government officials don’t care about the environment. That said, they clearly don’t take the threat of climate change as seriously as past administrations. This is evidenced by the EPA’s recently announced plan to repeal the 2009 endangerment finding that greenhouse gases pose a threat to public health and welfare, which would impact climate rules under the Clean Air Act. Rather, a more nuanced (or benign) perspective would suggest that the Trump administration is pursuing a more pragmatic approach that streamlines regulations to promote growth and lower costs to consumers. It also keeps the lights on. The recent Winter Storm Fern exemplifies this—without power generated from coal plants, there would have been brownouts across New England (see below for discussion).
WINTER STORM FERN HIGHLIGHTS HYDROCARBONS’ ROLE IN ENERGY RELIABILITY
Winter Storm Fern (1/23–1/27/26) caused widespread disruption from Northern Mexico to the Southern and Northeast United States and into Canada. The current administration argues that it could have been worse as reported in the U.S. Department of Energy (DOE) Fact Sheet: Energy Department Prevented Blackouts & Saved American Lives During Winter Storms.
On day one, President Trump declared a national energy emergency and the DOE took actions to support electricity access. Specifically in advance of Winter Storm Fern, the Trump Administration kept five reliable coal plants online to meet energy demand. At peak demand, hydrocarbons (coal, natural gas, and oil) reportedly provided 71% of power across impacted regions. When combined with nuclear generation, these sources accounted for 86% of total power. Solar contributed 2% (only about 11% of its nameplate capacity) and wind 8% (only around 23% of its nameplate capacity).
Regarding reliability of energy sources, the DOE noted that during peak demand:
· Coal generation increased by 25%
· Natural gas increased by 47%
· Oil electricity generation oil increased by 1,953%
· Wind generation decreased by 40%
OUR TAKE: Winter Storm Fern highlights the important role hydrocarbons currently play in ensuring energy reliability.
JANUARY REVIEW: ENERGY OUTPERFORMS
The rundown:
In January, SAM’s Infrastructure Income Portfolio produced a return (net of fees) of 7.1% compared to 1.5% for the S&P 500 and 7.4% for its customized benchmark. The performance relative to benchmark reflect our overweight in midstream and lower weights in the utilities and clean energy sectors.
In January, SAM’s Energy Transition Portfolio generated a return (net of fees) of 5.0% versus 8.7% for its customized benchmark.
SAM’s portfolios are more heavily weighted in Midstream, which outperformed relative to utilities but underperformed relative to the clean energy sector in January.
Midstream outperformed the overall market and was up in January with a total return of 8.1% as measured by the AMNAX.
In January, clean energy sector outperformed the overall market, generating a total return of 11.2% as measured by the S&P Global Clean Energy Index (SPGTCLTR). For the month, utilities slightly outperformed the market with a total return of 1.8% as measured by the Philadelphia Stock Exchange Utility Index (XUTY).
Sector performance in the S&P 500 was largely positive with nine out of eleven sectors posting positive performance. Energy was the best performer and Info Tech was the worst. Energy delivered a 14.4% monthly total return. January month-end WTI crude oil and Henry Hub natural gas prices were $64.50 Bbl and $7.18 per MMBtu, up ~13% and ~80%, respectively from last month.
YTD 2026 Total Return

Source: Bloomberg, NASDAQ and S&P Global
RESULTS: SINCE INCEPTION & ONE YEAR
SAM’s Infrastructure Income Portfolio produced a return (net of fees) of 160.1% and 8.2% for the periods since 11/10/20 inception and 1-year, respectively. This compares to a total return of 153.5% and 20.2%, respectively, for its customized benchmark and 111.3% and 19.1%, respectively, for the S&P 500 as of 1/30/26.
SAM’s Energy Transition Portfolio generated a return (net of fees) of 38.1% and 9.3% for the periods since 4/29/21 inception and 1-year, respectively. This compares to a total return of 49.2% and 36.7%, respectively, for its customized benchmark and 76.7% and 19.1%, respectively, for the S&P 500 as of 1/30/26.

Sam Partners’ Infrastructure Income and Energy Transition Strategies seek to provide sustainable income and growth with capital preservation. This is accomplished by investing in a concentrated portfolio of high-quality midstream energy companies, utilities and clean energy companies that are well positioned to participate in the energy transition to a net zero carbon future. A diversified approach to investments across these sectors should optimize risk-adjusted returns, in our view. Our Infrastructure Income Strategy offers investors a current yield of ~4.0% and growth potential of ~5-7%; while the Energy Transition Strategy that is more heavily weighted with clean energy stocks and aligns with favorable ESG ratings, offers investors a current yield of ~3.0%. In a world searching for yield, we believe these Strategies offer a compelling value proposition.
IMPORTANT DISCLOSURES
Siegel Asset Management Partners is a registered investment advisor located in Plainview, New York. The views expressed are those of Siegel Asset Management Partners and are not intended as investment advice or recommendation. This material is presented solely for informational purposes, and nothing herein constitutes investment, legal, accounting or tax advice, or a recommendation to buy, sell or hold a security. No recommendation or advice is being given as to whether any investment or strategy is suitable for a particular investor. Information is obtained from sources deemed reliable, but there is no representation or warranty as to its accuracy, completeness, or reliability. All information is current as of the date of this material and is subject to change without notice. Third-party economic, market or security estimates or forecasts discussed herein may or may not be realized and no opinion or representation is being given regarding such estimates or forecasts. Certain products and services may not be available in all jurisdictions or to all client types. Unless otherwise indicated, Siegel Asset Management Partners' returns reflect reinvestment of dividends and distributions. Indexes are unmanaged and are not available for direct investment. Investing entails risks, including possible loss of principal. Past performance is no guarantee of future results.


Comments